(N.B. I showed in the previous article that, with this simulation, the distribution of solution times is independent of the user rating.) I later discovered that I had no solution times under two seconds, so rounding the solution time up to the next integer may not have added to the realism. I saved the resulting data to a CSV file with the format:
User #, Problem #, Time, Score
Here is a short extract from the file:
0,497,3,0
0,498,41,0
0,499,56,1
1,0,17,0
1,1,120,1
1,2,14,1
I read this file into a Java program. I initially set the user and problem ratings to 1500 Elo. I calculated the user ratings from the problem ratings, and the problem ratings from the user ratings, and repeated this process four times. The chart below shows the user ratings after the first iteration (red) and the second iteration (blue):

The first iteration under estimated the ratings of the weaker users and over estimated the ratings of the stronger users. The user ratings for the next two iterations are coincident with the blue line on the scale of this graph. (The root mean square difference between the user ratings from the first and second iterations was 57 points. The corresponding difference from the second and third iterations was 1.4 points, and 0.027 points for the third and fourth iterations. This calculation error reduced by a factor of about fifty from one iteration to the next.)
The ratings calculated by this method are all relative to an arbitrary base rating. I therefore normalised the user ratings from the calculation so that their average was equal to the average of the correct ratings used to generate the data. The chart below shows the correct user ratings (blue) and the normalised estimates (red):

The standard deviation of the user ratings was 20 Elo points. I again normalised the problem ratings from the calculation so that their average was equal to that of the correct ratings. The chart below shows the correct problem ratings (blue) and the normalised estimates (red):

The standard deviation of the problem ratings was 60 points. The standard deviation of the problem ratings was larger than that of the user ratings by a factor of roughly the square root of 10. (This result is not surprising, because the problem ratings are based on 50 data points rather than 500 data points for the user ratings, i.e. ten times fewer data points. N.B. The standard deviation of the mean of sampled values is inversely proportional to the square root of the number of values sampled.)
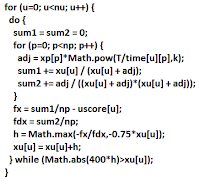
The principal variables used in the rating calculation are:
nu = number of users.
xu[u] = 10^(Ru/400) where Ru is the rating of user number u.
uscore[u] = score of user number u.
np = number of problems.
xp[u] = 10^(Rp/400) where Rp is the rating of problem number p.
pscore[p] = score of problem number p.
T = 30 seconds.
k = 200/(400*log(2)) = 1.660964047.
fx = f(x)
fdx = f'(x)
(N.B. It is necessary to check that 0<uscore[u]<1 and 0< pscore[p]<1, for all valid u and p.)
Here is the Java code for calculating the user ratings:
Here is the Java code for the problem ratings:
I have added some refinements since my earlier articles: Rating by Expected Score, and A Simpler Server Rating Method. The code above always converges from any starting value, and does one more iteration than is necessary to achieve approximately one Elo point accuracy.


No comments:
Post a Comment